Abstract.
A 1D photonic crystal structure with a terminal palladium
layer supporting long-range surface plasmon polariton
(LRSPP) waves in any gaseous environment is described.
We
show that LRSPP propagation may be achieved
not only along
"good plasmonic" metals such as Ag
and Au, but also along lossy metals such as Pd, which does not usually support
plasmon propagation in the visible spectral range with
ordinary Kretschmann excitation.
The possibility of the LRSPP propagation along catalytically active metals such as
Pd or Pt opens up new perspectives for studying of (photo)chemical surface reactions, and offers
the potential for more applications in the general area of catalysis, photocatalysis and plasmon
mediated chemistry.
We present experimental results that
demonstrate the hydrogen sensitivity of this photonic structure
incorporating a catalytically active 8 nm-thick Pd final layer.
A 3% hydrogen concentration in nitrogen is detected
with an S/N ratio of approximately 300,
with a response time of about 10
seconds at room temperature.
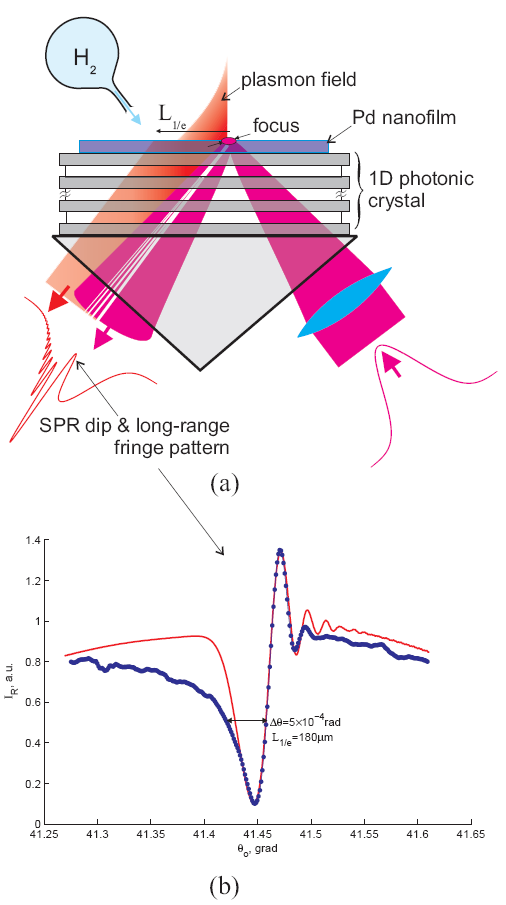
Fig.1 (a) Sketch of the experimental setup. An incident and then reflected focused laser beam is shown in magenta color, while the LRSPP propagated along the surface and then backcoupled into the prism is displayed in a different (red) color to distinguish between them. Both the SPR dip and the fringe pattern near the dip are the result of interference between these waves. (b) Angular SPR curves: experimental points (blue) and theoretical calculation (red). A discrepancy between calculated and observed values at angles q0 < 41.43o is due to a strong LRSPP scattering near the total internal reflection angle.
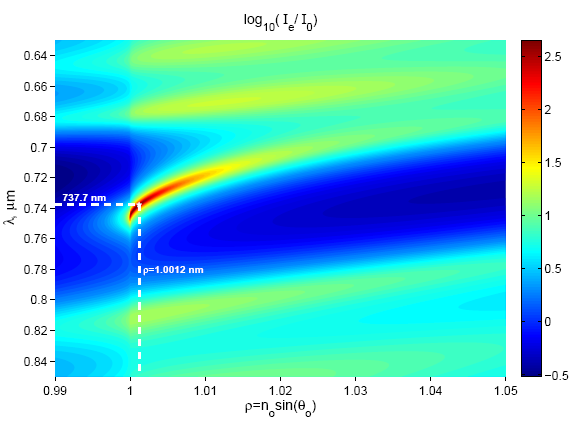
Fig.2 The calculated dispersion of the 1D PC structure with the terminal Pd nanolayer in air and the experimental point (white pentagram) of l = 737.7 nm, r = 1.0012. The LRSPP mode is seen as the red curve (with an enhancement of more than 100) inside the band gap (blue areas with an enhancement of less than 1).
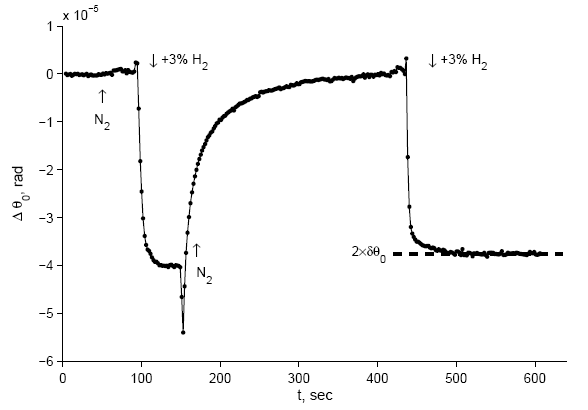
Fig.3 Changes in the effective RI of the surface wave nsw in response to hydrogen injection.